


2nd Look at Local Housing Markets in July
Tracking local data gives an early look at what happened the previous month and also reveals regional differences in both sales and inventory.
Closed sales in July were mostly for contracts signed in May and June, and mortgage rates, according to the Freddie Mac PMMS, 6.82% in May and 6.82% in June (somewhat higher than for closed sales in June).
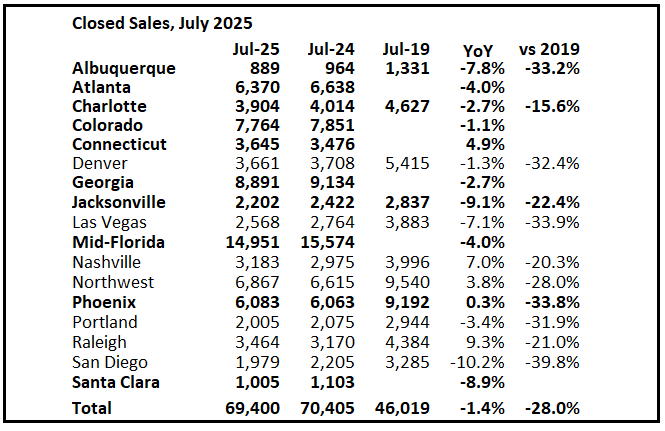
Closed Sales in July
In July, sales in these early reporting markets were down 1.4% YoY. Last month, in June, these same markets were up 3.8% year-over-year Not Seasonally Adjusted (NSA).
Important: There were the same number of working days in July 2025 (22) as in July 2024 (22). So, the year-over-year change in the headline SA data will be similar to the NSA data.
Notes for all tables:
New additions to table in BOLD.
Northwest (Seattle), Jacksonville Source: Northeast Florida Association of REALTORS®
Totals do not include Atlanta and Denver (included in state totals)
Comparison to 2019 ONLY includes local markets with available 2019 data!
For the previous month (June), there were more working days in June 2025 (20) than in June 2024 (19). So, the year-over-year change in the headline SA data was lower than for the NSA data. The NAR reported sales seasonally adjusted were unchanged year-over-year although the NSA data showed a gain (+4.0%) although there are other seasonal factors.
Sales in all of these markets are down sharply compared to July 2019.
This graph shows existing home sales by month for 2024 and 2025, on a Seasonally Adjusted Annual Rate (SAAR) basis. Last year, the NAR reported sales in July 2024 were at 3.98 million SAAR.
The previous month, June, and the next three months - July through September - will be the easiest year-over-year comparisons.
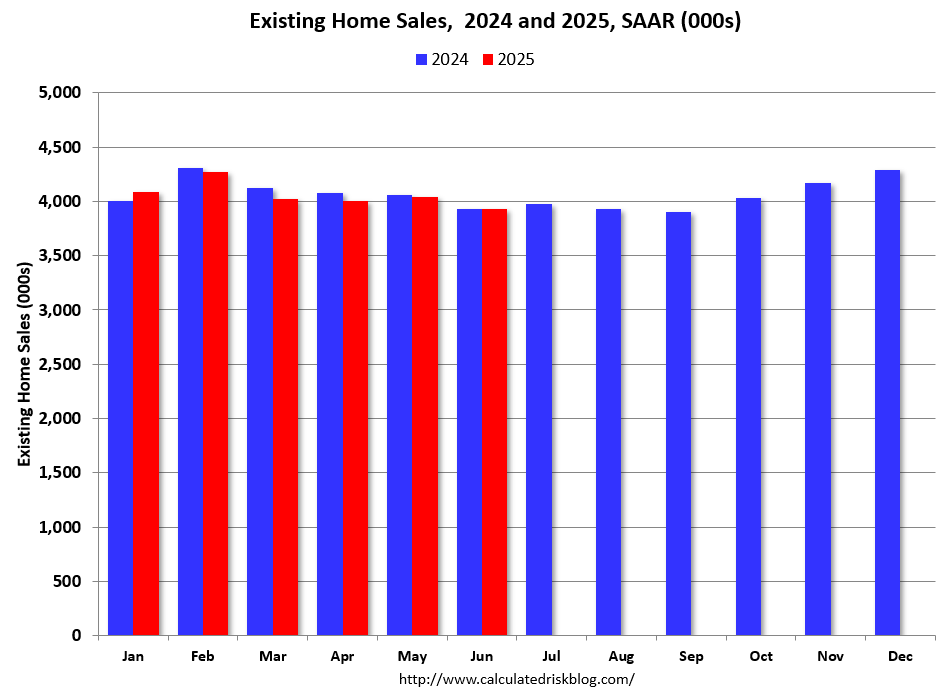
This data suggests that the July existing sales (as reported by the NAR will likely be mostly unchanged year-over-year.
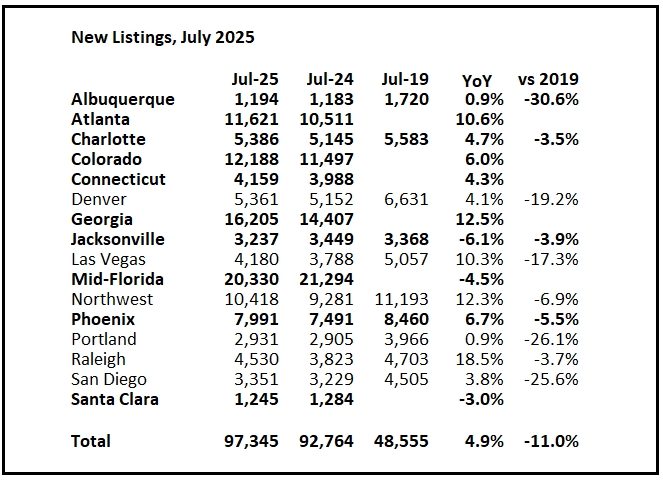
New Listings in July
For these areas, new listings were up 4.9% year-over-year.
Last month, new listings in these markets were up 4.0% year-over-year.
New listings are up solidly year-over-year, but down 11.0% compared to July 2019 activity.
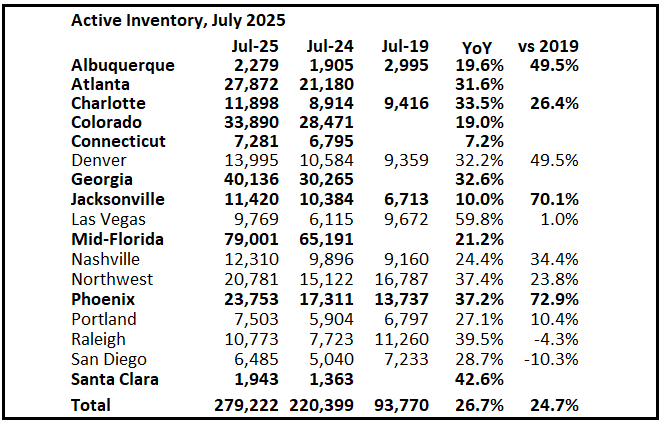
Active Inventory in July
Inventory was up 26.7% year-over-year. Last month inventory in these markets was up 30.4% YoY. Inventory picked up more than usual this Spring and Summer.
Comparing to July 2019, inventory is up sharply in Jacksonville and Phoenix and down in San Diego. There are significant regional differences in inventory.
Many more local markets to come!