4th Look at Local Housing Markets in December
Here are a few more local markets before the NAR releases December Existing Home sales tomorrow, Friday, January 24th at 10:00 AM. This will be the 3rd consecutive month with a year-over-year increase in sales.
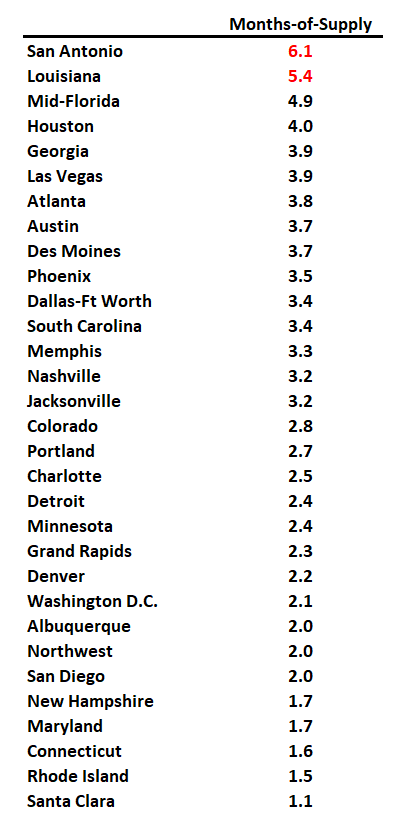
Watch the regional difference! Inventory is recovering quicker than sales in some areas (especially Florida and Texas), and this is pushing up months-of-supply - and could lead to some price declines in 2025.
The consensus is for 4.20 million SAAR, up from 4.15 million in November. Last year, the NAR reported sales in December 2023 at 3.88 million SAAR. Housing economist Tom Lawler expects the NAR to report sales of 4.15 million SAAR for December.
This is the fourth look at several early reporting local markets in December. I’m tracking over 40 local housing markets in the US. Some of the 40 markets are states, and some are metropolitan areas. I’ll update these tables throughout the month as additional data is released. The tables for active listings, new listings and closed sales all include a comparison to December 2019 for each local market (some 2019 data is not available).
Closed sales in December were mostly for contracts signed in October and November when 30-year mortgage rates averaged 6.43% and 6.81%, respectively (Freddie Mac PMMS). This was an increase from the average rate for homes that closed in November, but down from the average rate of 7.5% in October and November 2023.
Months of Supply
Here is a look at months-of-supply using NSA sales. Since this is NSA data, it is likely this will be the seasonal low for months-of-supply.
Active Inventory in December
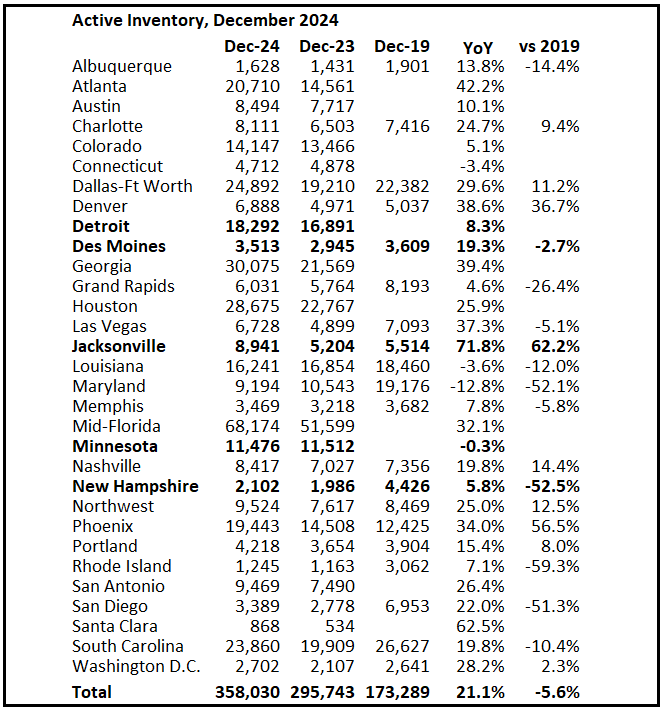
Here is a summary of active listings for these housing markets.
Inventory was up 21.1% year-over-year. Last month inventory in these markets were also up 21.4% YoY.
There are significant regional differences for inventory, with sharp increases in the South and Southeast (especially in Florida and Texas).
Comparing to December 2019, inventory is up in several areas and down sharply in Maryland, Rhode Island and San Diego.
Notes for all tables:
New additions to tables in BOLD.
Northwest (Seattle), Jacksonville Source: Northeast Florida Association of REALTORS®
Totals do not include Atlanta and Denver (included in state totals)
Comparison to 2019 ONLY includes local markets with available 2019 data!
New Listings in December
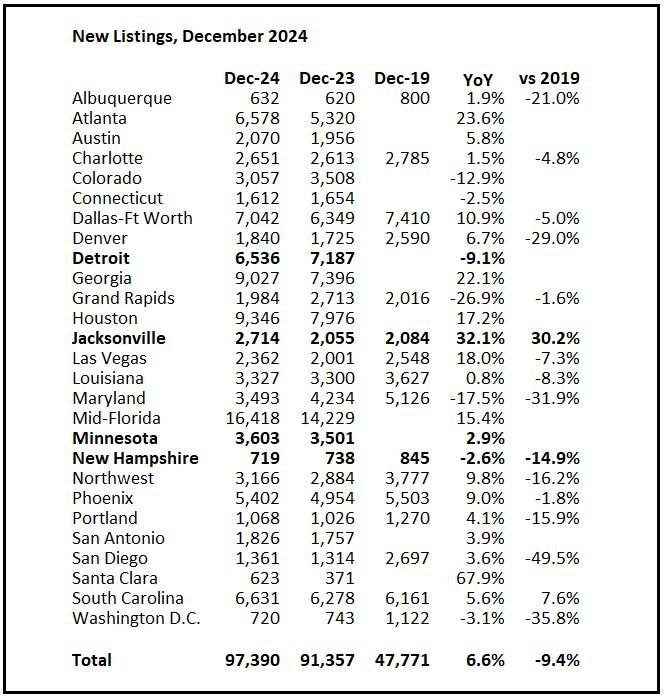
And here is a table for new listings in December (some areas don’t report new listings). For these areas, new listings were up 6.6% year-over-year. Note that December is usually the slowest month for new listings due to the holidays.
Last month, new listings in these markets were up 2.9% year-over-year.
New listings are now up year-over-year, but still at historically low levels. New listings in most of these areas are down compared to December 2019 activity.
Closed Sales in December
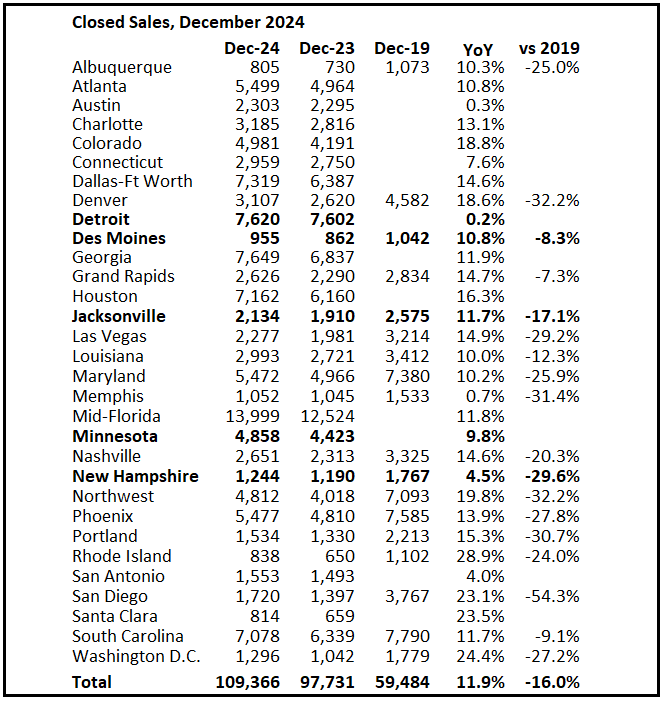
And a table of December sales.
In December, sales in these markets were up 11.9% YoY. Last month, in November, these same markets were up 5.2% year-over-year Not Seasonally Adjusted (NSA).
Important: There was one more working day in December 2024 (21) as compared to December 2023 (20). So, the year-over-year change in the headline SA data will less than the NSA data suggests (there are other seasonal factors).
Last month, there was one fewer working day in November 2024 (19) as compared to November 2023 (20). So, the year-over-year change in the headline SA data was better than the NSA data suggested.
Sales in all of these markets are down compared to December 2019.
Several local markets - like Illinois, Miami, New Jersey and New York - will report after the NAR release.


