


Final Look at Local Housing Markets in June and a Look Ahead to July Sales
After the National Association of Realtors® (NAR) releases the monthly existing home sales report, I pick up additional local market data that is reported after the NAR. This is the final look at local markets in June.
There were several key stories for June:
Sales NSA are down 1.5% year-over-year (YoY) through June compared to the same period in 2024, and sales last year were the lowest since 1995! The YoY comparisons will be fairly easy for the next three months, so sales in 2025 might be close to the level in 2024.
Sales SA were down or unchanged YoY for the 5th consecutive month and have been down YoY for 41 of the last 46 months.
Months-of-supply is at the highest level since 2016.
The median price is barely up YoY, and with the increases in inventory, some regional areas will see more price declines - and we might see national price declines later this year (or in 2026).
Sales at 3.93 million on a Seasonally Adjusted Annual Rate (SAAR) basis were below the consensus estimate; however, housing economist Tom Lawler’s estimate was right on (usually very close).
Sales averaged close to 5.40 million SAAR for the month of June in the 2017-2019 period. So, sales are about 27% below pre-pandemic levels.
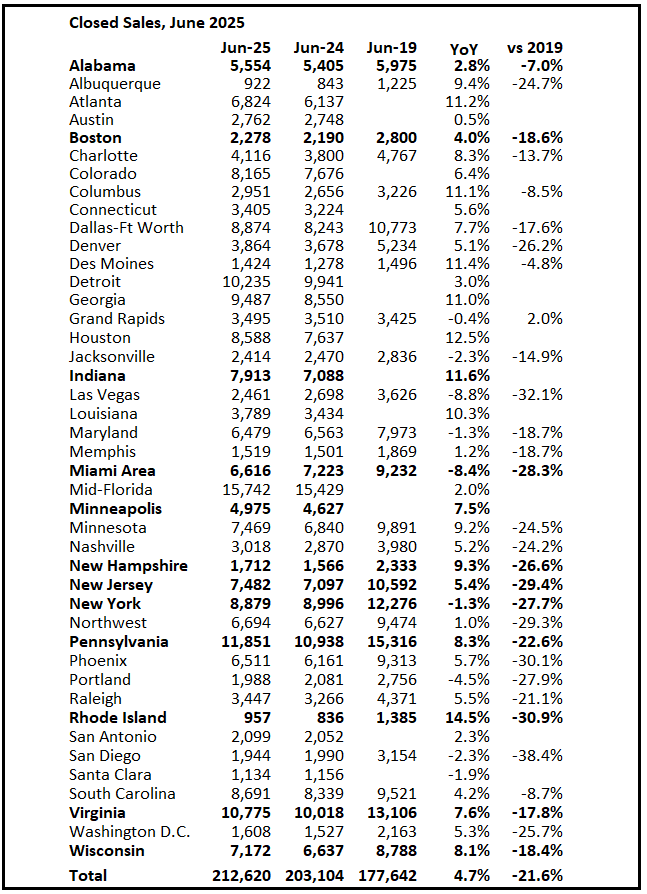
Closed Sales in June
In June, sales in these markets were up 4.7% YoY NSA. Last month, in May, these same markets were also down 3.8% YoY Not Seasonally Adjusted (NSA). The NAR reported sales in June were up 4.0% YoY NSA, so this sample is close.
Important: There were more working days in June 2025 (20) than in June 2024 (19). So, the year-over-year change in the headline SA data was lower than for the NSA data. According to the NAR, seasonally adjusted sales were unchanged YoY in June.
Notes for all tables:
New additions to table in BOLD.
Northwest (Seattle), Jacksonville Source: Northeast Florida Association of REALTORS®
Totals do not include Atlanta, Denver and Minneapolis (included in state totals)
Comparison to 2019 ONLY includes local markets with available 2019 data!
For next month (July 2025 sales): There were the same number of working days in July 2025 (22) as in July 2024 (22). So, the year-over-year change in the headline SA data will be similar to the NSA data.
July sales will be mostly for contracts signed in May and June, and mortgage rates averaged 6.82% in May and 6.82% in June (somewhat higher than for closed sales in June).
My early expectation is that we will see existing home sales (SA) mostly unchanged in July compared to July 2024 (3.98 million SAAR).
This graph shows existing home sales by month for 2024 and 2025. In June, sales were unchanged year-over-year following four consecutive months with a YoY decline. Year-to-date, sales are down 1.5% NSA. The next three months will have fairly easy year-over-year comparisons.
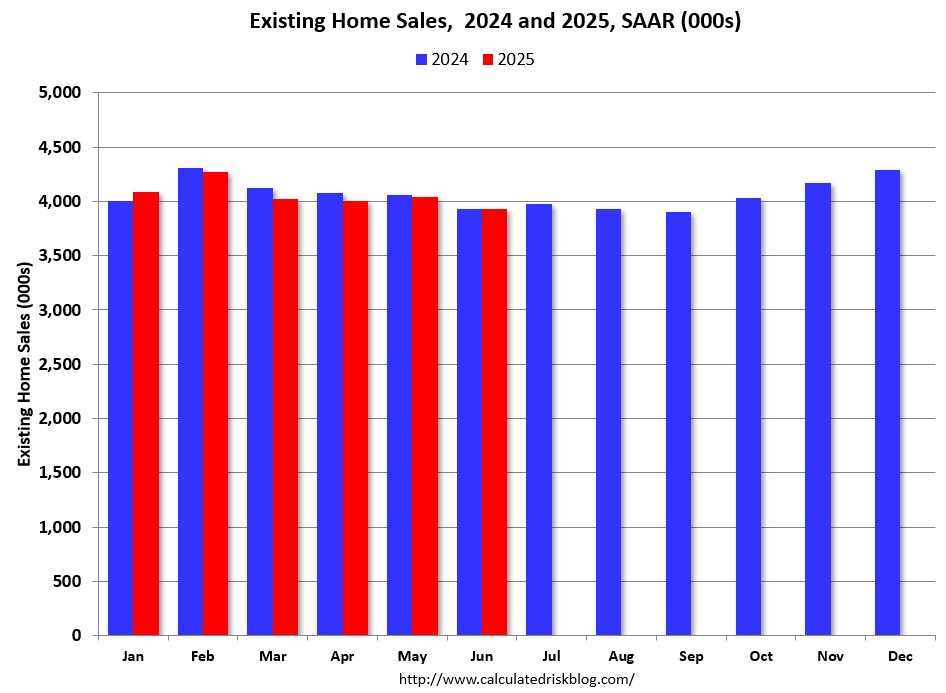
Total sales last year (2024) were the lowest since 1995 (lower than any year during the housing bust), so it says something that sales are tracking even lower in 2025!
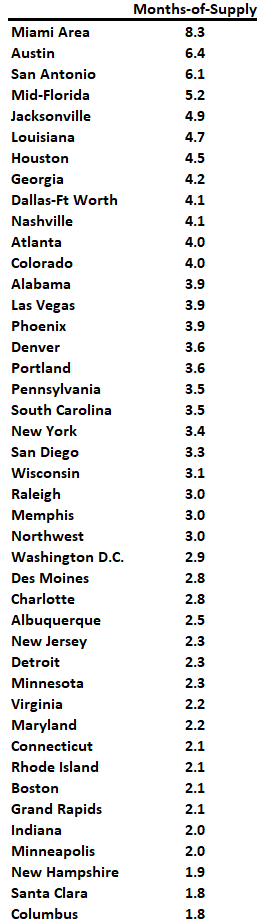
Months of Supply
Here is a look at months-of-supply using NSA sales. Since this is NSA data, it is likely months-of-supply will increase further in late Summer. There are 14 months of supply of condos in Miami-Dade!
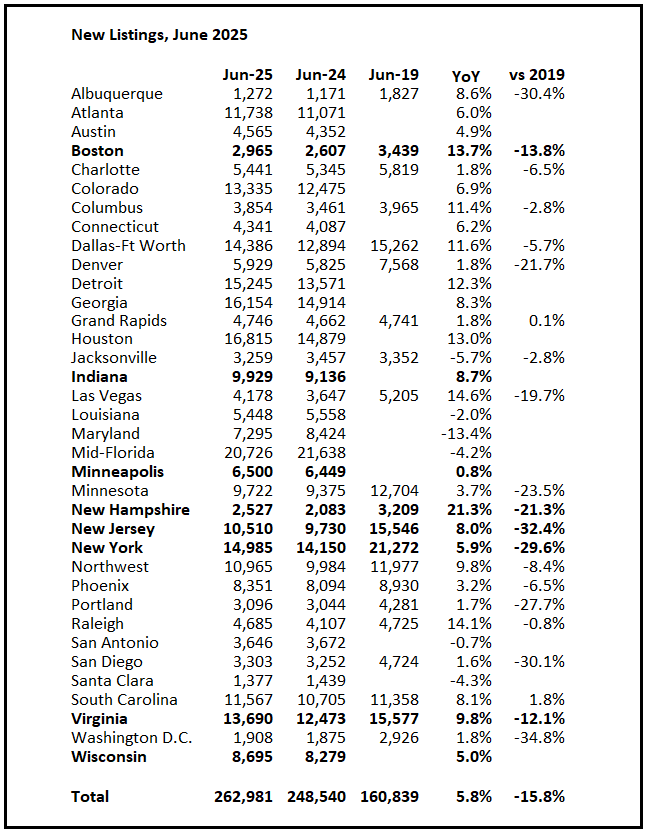
New Listings in June
For these areas, new listings were up 5.8% year-over-year.
Last month, new listings in these markets were up 6.1% year-over-year.
New listings are now up year-over-year, but down 16% compared to June 2019 activity for the cities that I have 2019 data.
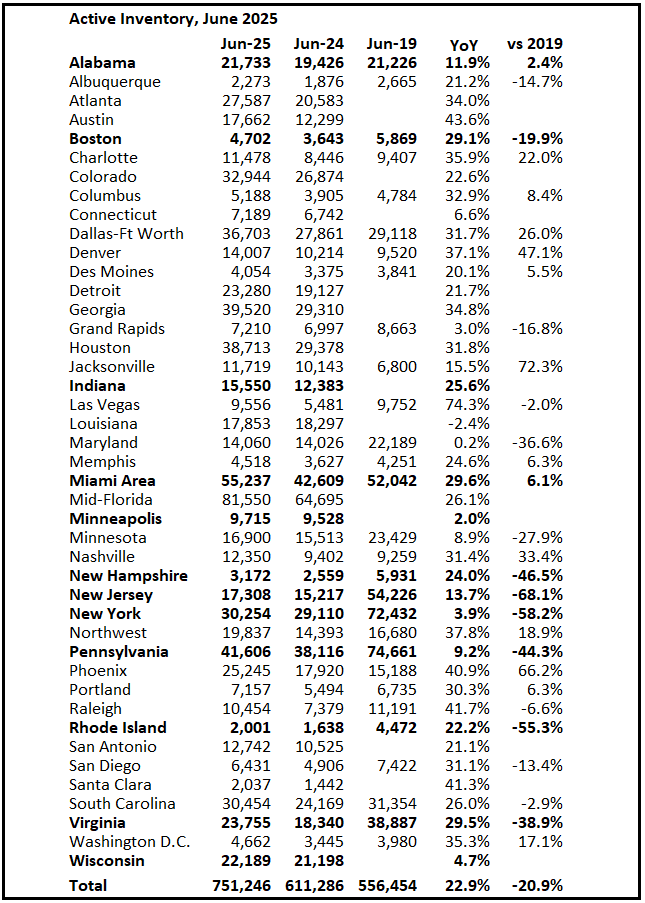
Active Inventory in June
Inventory was up 22.9% year-over-year. Last month inventory in these markets was up 25.4% YoY. Inventory is picking up more than usual seasonally.
Also note the significant regional differences.
More local data coming in August for activity in July!