


Housing Starts Decreased to 1.324 million Annual Rate in March

First, from Reuters: D.R. Horton cuts 2025 revenue forecast on weak demand for homes
U.S. homebuilder D.R. Horton lowered its full-year revenue forecast and missed second-quarter profit and revenue estimates on Thursday due to weak demand for homes. … It sees about 85,000 to 87,000 transaction closings from homebuilding operations, down from its earlier forecast of 90,000 to 92,000 homes.
I discussed weaker demand and higher costs last month in Policy and 2025 Housing Outlook
Housing Starts Decreased to 1.324 million Annual Rate in March
From the Census Bureau: Permits, Starts and Completions
Housing Starts:
Privately-owned housing starts in March were at a seasonally adjusted annual rate of 1,324,000. This is 11.4 percent below the revised February estimate of 1,494,000, but is 1.9 percent above the March 2024 rate of 1,299,000. Single-family housing starts in March were at a rate of 940,000; this is 14.2 percent below the revised February figure of 1,096,000. The March rate for units in buildings with five units or more was 371,000.
Building Permits:
Privately-owned housing units authorized by building permits in March were at a seasonally adjusted annual rate of 1,482,000. This is 1.6 percent above the revised February rate of 1,459,000, but is 0.2 percent below the March 2024 rate of 1,485,000. Single-family authorizations in March were at a rate of 978,000; this is 2.0 percent below the revised February figure of 998,000. Authorizations of units in buildings with five units or more were at a rate of 445,000 in March.
emphasis added
The first graph shows single and multi-family housing starts since 2000 (including housing bubble).
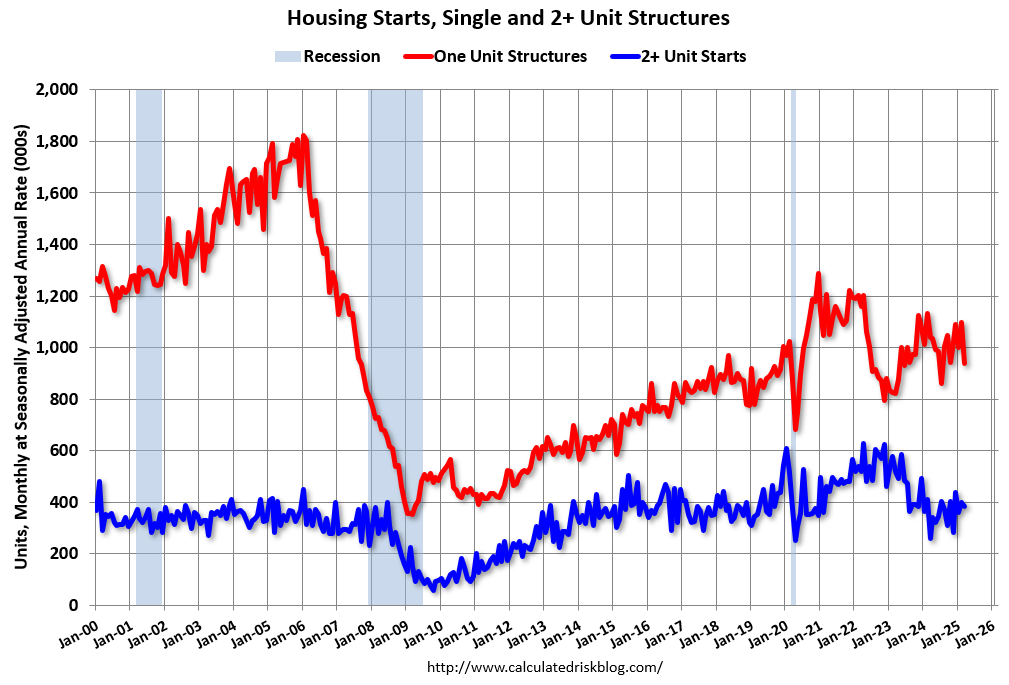
Multi-family starts (blue, 2+ units) decreased month-over-month in March. Multi-family starts were up sharply year-over-year (March 2024 was very weak for multi-family). Single-family starts (red) decreased in March and were down 9.7% year-over-year.
The second graph shows single and multi-family starts since 1968. This shows the huge collapse following the housing bubble, and then the eventual recovery - and the pandemic related volatility.
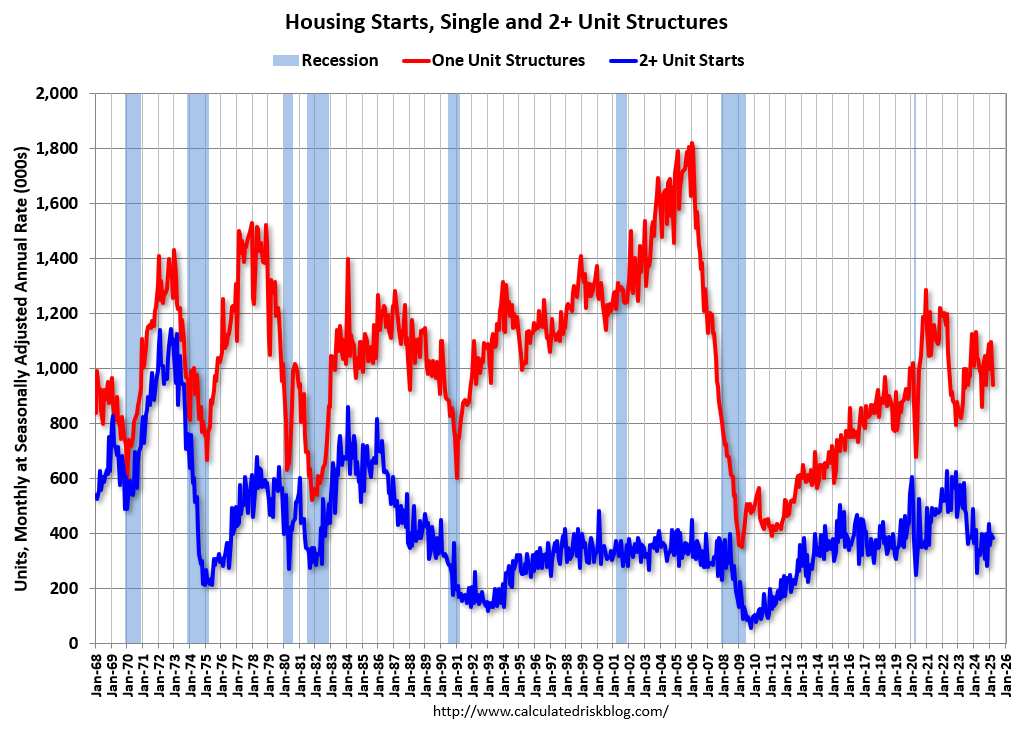
Total housing starts in March were well below expectations; however, starts in January and February were revised up slightly, combined.
The third graph shows the month-to-month comparison for total starts between 2024 (blue) and 2025 (red).

Total starts were up 1.9% in March compared to March 2024. Year-to-date (YTD) starts are down 1.5% compared to the same period in 2024. Single family starts are down 5.6% YTD and multi-family up 9.0% YTD.
Multi-Family Housing Units Under Construction Remains Elevated
The fourth graph shows housing starts under construction, Seasonally Adjusted (SA).
The following content is for paid subscribers only. Thanks to all paid subscribers!
Keep reading with a 7-day free trial
Subscribe to CalculatedRisk Newsletter to keep reading this post and get 7 days of free access to the full post archives.