


Inflation Adjusted House Prices 0.8% Below 2022 Peak
Price-to-rent index is 7.4% below 2022 peak

It has been over 18 years since the housing bubble peak. In the January Case-Shiller house price index released this week, the seasonally adjusted National Index (SA), was reported as being 78% above the bubble peak in 2006. However, in real terms, the National index (SA) is about 12% above the bubble peak (and historically there has been an upward slope to real house prices). The composite 20, in real terms, is 3% above the bubble peak.
People usually graph nominal house prices, but it is also important to look at prices in real terms. As an example, if a house price was $300,000 in January 2010, the price would be $440,000 today adjusted for inflation (47% increase). That is why the second graph below is important - this shows "real" prices.
The third graph shows the price-to-rent ratio, and the fourth graph is the affordability index. The last graph shows the 5-year real return based on the Case-Shiller National Index.
Nominal House Prices
The first graph shows the monthly Case-Shiller National Index SA, and the monthly Case-Shiller Composite 20 SA in nominal terms as reported.
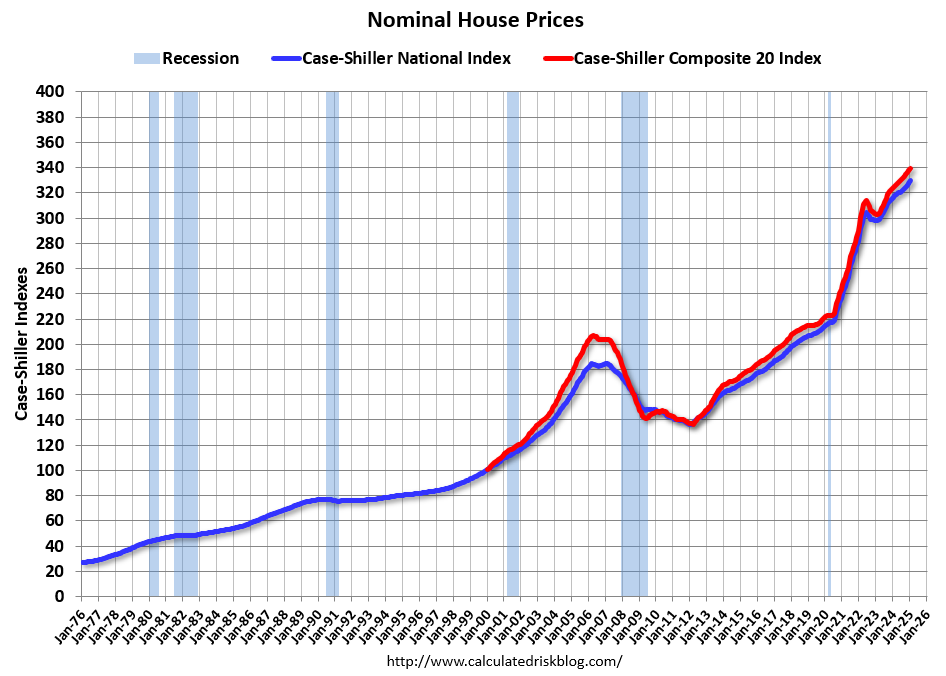
In nominal terms, the Case-Shiller National index (SA) and the Case-Shiller Composite 20 index (SA) are both at all times highs. Both indexes increased in January.
Real House Prices
The second graph shows the same two indexes in real terms (adjusted for inflation using CPI).
In real terms (using CPI), the National index is 0.8% below the recent peak, and the Composite 20 index is 1.2% below the recent peak in 2022. The real National index and the Composite 20 index increased slightly in real terms in January.
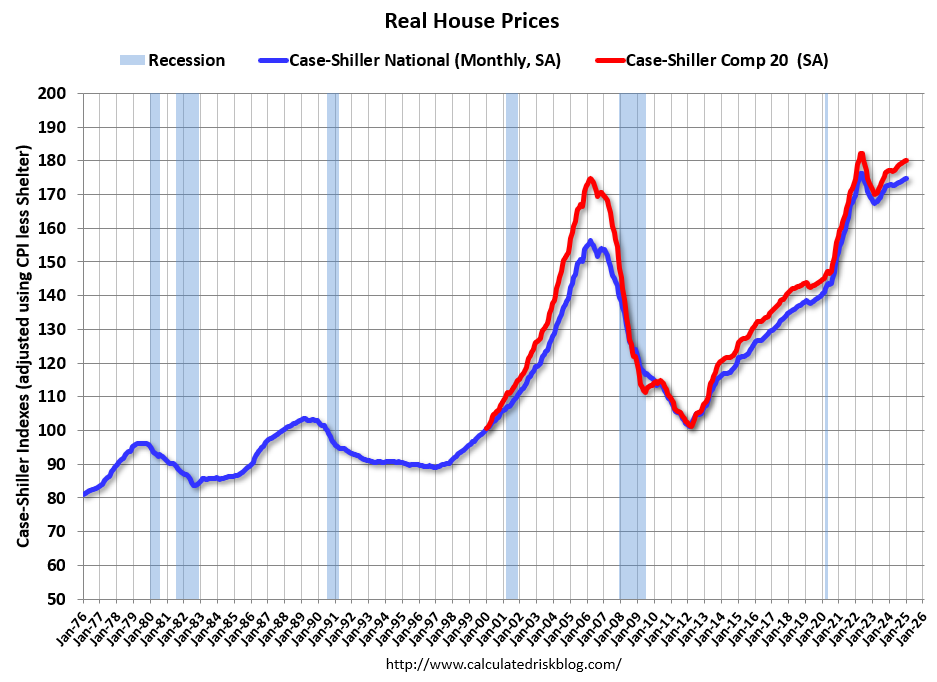
The National index increased in real terms in January, and the Comp-20 index decreased slightly.
It has now been 32 months since the real peak in house prices. Typically, after a sharp increase in prices, it takes a number of years for real prices to reach new highs (see House Prices: 7 Years in Purgatory). There is nothing magic about “7 years”, it just made a good post title!
My guess on house prices is “mostly flat prices nationally in 2025” which would suggest a slight decline in real prices.
In real terms, national house prices are 11.8% above the bubble peak levels. There is an upward slope to real house prices, and it has been over 18 years since the previous peak, but real prices are historically high.
Price-to-Rent Ratio
The following content is for paid subscribers only. Thanks to all paid subscribers!
Keep reading with a 7-day free trial
Subscribe to CalculatedRisk Newsletter to keep reading this post and get 7 days of free access to the full post archives.