Discover more from CalculatedRisk Newsletter
Mortgage Rate Update
Mortgage News Daily reports that the most prevalent 30-year fixed rate is now at 6.18% for top tier scenarios. Usually there is a fairly steady spread between the ten-year Treasury yield and 30-year mortgage rates, although - as housing economist Tom Lawler explained in Mortgage/Treasury Spreads, Part I and Part II - the spread has widened due to several factors including volatility and pre-payment speeds.
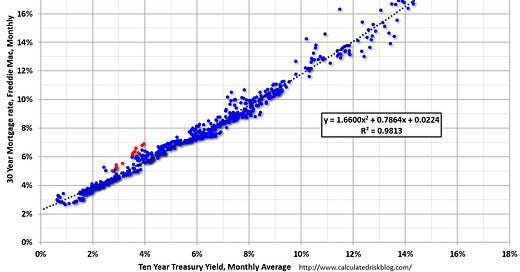
With the ten-year yield at 3.3%, and based on an historical relationship, 30-year rates would currently be around 5.0%. So, mortgage rates are higher than expected based on the ten-year yield - for reasons Lawler explained.
The graph shows the relationship between the monthly 10-year Treasury Yield and 30-year mortgage rates from the Freddie Mac survey. Note that the red dots are the last 12 months of data.
Freddie Mac has a similar graph here with a linear fit (using data since 1990). Using their formula, 30-year rates would also be around 5.0%.
This suggests that if volatility declines then mortgage rates will move back towards the historical spread. However - if the Fed stops raising rates - it is possible the ten-year Treasury yield might increase (and the yield curve will flatten), and mortgage rates will stay close to 6% (it isn’t simple!). Currently the 3-month T-bill yield 4.86%, more than 1.5 percentage points above the 10-year yield.
What has happened to Refinance Activity?
In an article over year ago, I predicted that refinance activity would fall off a cliff.
The following graph shows the MBA Refinance Index (Blue) since 1990.
The general rule of thumb is refinance activity will be strong if current mortgage rates are 50bps lower than the maximum of the previous year (this is just a general rule - but it works pretty well).
Since rates have fallen from the highs in October and November, we might see a slight pickup in refinance activity for these recent buyers (usually buyers have to wait 6 months if using the same lender).