CalculatedRisk Newsletter

CalculatedRisk Newsletter

Share this post

CalculatedRisk Newsletter
Real House Prices, Price-to-Rent Ratio and Price-to-Median Income in July
Copy link
Facebook
Email
Notes
More

Real House Prices, Price-to-Rent Ratio and Price-to-Median Income in July

And a look at "Affordability"

CalculatedRisk by Bill McBride's avatar
CalculatedRisk by Bill McBride
Sep 29, 2021
∙ Paid
3

Share this post

CalculatedRisk Newsletter
Real House Prices, Price-to-Rent Ratio and Price-to-Median Income in July
Copy link
Facebook
Email
Notes
More
Share

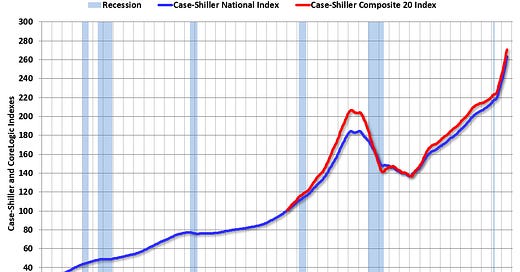
It has been over fifteen years since the bubble peak. In the Case-Shiller release yesterday, the seasonally adjusted National Index (SA), was reported as being 43% above the bubble peak in 2006. However, in real terms, the National index (SA) is about 8.5% above the bubble peak (and historically there has been an upward slope to real house prices).  The…

Keep reading with a 7-day free trial

Subscribe to CalculatedRisk Newsletter to keep reading this post and get 7 days of free access to the full post archives.

Already a paid subscriber? Sign in
© 2025 CalculatedRisk
Privacy ∙ Terms ∙ Collection notice
Start writingGet the app
Substack is the home for great culture

Share

Copy link
Facebook
Email
Notes
More