


Watch Months-of-Supply!

Both inventory and sales are well below pre-pandemic levels, and I think we need to keep an eye on months-of-supply to forecast price changes. Historically nominal prices declined when months-of-supply approached 6 months - and that is unlikely any time soon - however, as expected, months-of-supply is back to 2019 levels.
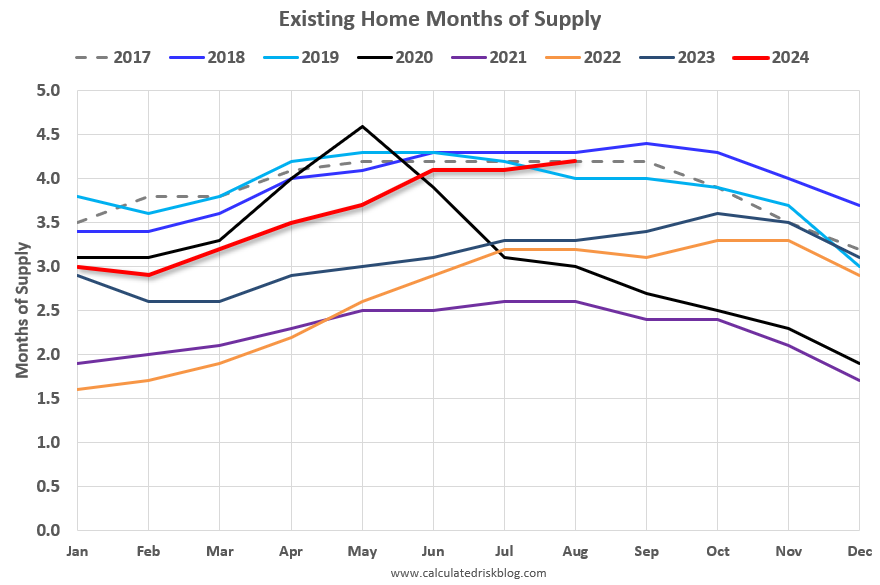
Months-of-supply was at 4.2 months in August compared to 4.0 months in August 2019. Even though inventory has declined significantly compared to 2019, sales have fallen even more - pushing up months-of-supply.
The following graph shows months-of-supply since 2017. Note that months-of-supply is higher than the last 3 years (2021 - 2023), and above August 2019. Months-of-supply was at 4.2 in August 2017 and 4.3 in August 2018. In 2020 (black), months-of-supply increased at the beginning of the pandemic and then declined sharply.
In an interview in July with Lance Lambert at ResiClub, I noted that house prices might decline if months-of-supply reaches around 5 months:
"I expect this measure to continue to increase, and be over 4 months soon – and to be above 2019 levels in a few months. This doesn’t mean national price declines, but it suggests price growth will slow significantly later this year. We might see national price decline with months-of-supply above 5 (as opposed to 6) since most potential sellers have substantial equity and might be willing to sell for a little less."
This graph below shows existing home months-of-supply, inverted, from the National Association of Realtors® (NAR) vs. the seasonally adjusted month-to-month price change in the Case-Shiller National Index (both since January 1999 through June 2024). The Case-Shiller index for July will be released tomorrow.
Starting in 2022, the months are in black (the last 6 months in Blue) showing that prices fell for seven months with low levels of inventory in 2022!

In June, the months-of-supply was at 4.2 months, and the Case-Shiller National Index (SA) increased 0.16% month-over-month. If the trend over the last several months (blue dashed line) suggests we might see national price declines if inventory reaches around 5 months of supply. It seems very unlikely we will see 5 months-of-supply this year, but that might be a 2025 story.
What would it take to get months-of-supply above 5 months? If sales stay depressed at 2023 and 2024 levels, how much would inventory have to increase to put months-of-supply at 5 months by, say, June 2024?
The following content is for paid subscribers only. Thanks to all paid subscribers!
Keep reading with a 7-day free trial
Subscribe to CalculatedRisk Newsletter to keep reading this post and get 7 days of free access to the full post archives.