
Final Look at Local Housing Markets in April and a Look Ahead to May Sales

Please see a Memorial Day note at bottom.
After the National Association of Realtors® (NAR) releases the monthly existing home sales report, I pick up additional local market data that is reported after the NAR. This is the final look at local markets in April.
There were several key stories for April:
Sales NSA are down YoY through April, and sales last year were the lowest since 1995! Ouch.
Sales SA were down YoY for the 3rd consecutive month and 40 of the last 44 months.
Months-of-supply is at the highest level since 2016 (excluding one month near the start of the pandemic).
The median price is barely up YoY, and with the increases in inventory, some regional areas will see more price declines.
Sales at 4.00 million on a Seasonally Adjusted Annual Rate (SAAR) basis were below the consensus estimate; however, housing economist Tom Lawler’s estimate was very close (as usual).
Sales averaged close to 5.4 million SAAR for the month of April in the 2017-2019 period. So, sales are about 26% below pre-pandemic levels.
Also, months-of-supply for April was above pre-pandemic levels for the period 2017-2019 and the highest for April since 2016.
NOTE: The tables for active listings, new listings and closed sales all include a comparison to April 2019 for each local market (some 2019 data is not available).
Months of Supply
Here is a look at months-of-supply using NSA sales. Since this is NSA data, it is likely months-of-supply will increase over the next few months.
Months in red are areas that are seeing 5+ months of supply now and might see price pressures later this summer.

Active Inventory in April
Here is a summary of active listings for these early reporting housing markets.
Inventory was up 25.5% year-over-year. Last month inventory in these markets was up 24.7% YoY. Inventory is picking up more than usual in the Spring.
There are significant regional differences for inventory, with sharp increases in the South and Southeast (especially in Florida and Texas).
Notes for all tables:
New additions to table in BOLD.
Northwest (Seattle), Jacksonville Source: Northeast Florida Association of REALTORS®
Totals do not include Atlanta, Denver and Minneapolis (included in state totals)
Comparison to 2019 ONLY includes local markets with available 2019 data!

New Listings in April
And here is a table for new listings in April (some areas don’t report new listings). For these areas, new listings were up 9.6% year-over-year.
Last month, new listings in these markets were up 13.9% year-over-year.
New listings are now up year-over-year, but still down compared to April 2019 activity.

Closed Sales in April
And a table of April sales.
In April, sales in these markets were down 3.8% YoY. Note: The NAR reported sales down 3.1% NSA in April, so this was close.
Last month, in March, these same markets were down 3.5% year-over-year Not Seasonally Adjusted (NSA).
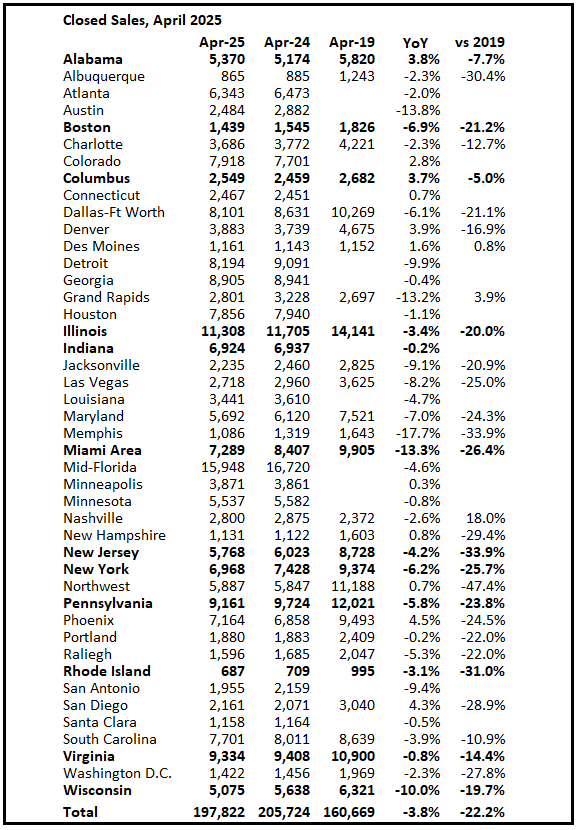
Important: There were the same number of working days in April 2025 (22) as in April 2024 (22). So, the year-over-year change in the headline SA data was close to the change in the NSA data (there are other seasonal factors).
For next month (May 2025 sales): There were fewer working days in May 2025 (21) as in May 2024 (22). So, the year-over-year change in the headline SA data will be higher than for the NSA data.
May sales will be mostly for contracts signed in March and April, and mortgage rates averaged 6.65% in March and 6.73% in April (slightly lower than for closed sales in April).
My early expectation is that we will see existing home sales (SA) mostly unchanged to down year-over-year in May compared to May 2024 (4.06 million SAAR). The negative economic impacts from policy mostly happened in April, and that might impact existing home sales in the May report.
This graph shows existing home sales by month for 2024 and 2025. In April, sales were down year-over-year for the 3rd consecutive month. Year-to-date, sales are down 2.4% NSA.

More local data coming in June for activity in May!
Memorial Day: Remembering James Hoey
Memorial Day is about remembering those that in the words of Abraham Lincoln, “gave the last full measure of devotion” in defending our nation so “that this government of the people, by the people, for the people, shall not perish from the earth”.
Today I’m thinking of my distant relative, James Hoey (Jan 14, 1842 – Aug 13, 1864) who fought for the Union during the Civil War and gave the ultimate sacrifice at the age of 22. Thank you, James!
My family has fought in every major American war. For example, my 4th Great Grandfather, William Marks (1749 – 1824) fought in the revolutionary war. His son, my 3rd Great Grandfather, William Marks, Jr. was a Brigadier General during the war of 1812 – and went on the serve as a U.S. Senator from the State of Pennsylvania.
We must also remember what they all fought for: America’s core value is the rule of law rooted in the U.S. Constitution. We are a Nation of Laws, not of men.
Thank you for adding Raleigh to your list of markets you track! Also wanted to note that Raleigh is spelled wrong on the list you just posted (it says "Raliegh") https://calculatedrisk.substack.com/p/final-look-at-local-housing-markets-66c