


Goldman's Mid-Year Housing Outlook

Last Friday, Goldman Sachs Senior economist Ronnie Walker wrote: Mid-Year Housing Outlook: Slowing Construction and Price Growth, Not Just for Multifamily
Here are a few brief excerpts and my comments (CR):
Goldman on existing home sales: “Sustained higher mortgage rates will continue to have their most pronounced impact on housing turnover. 87% of mortgage borrowers have interest rates below current market rates, and 66% have rates 2pp below market rates, strongly disincentivizing them from moving. As a result, we expect annual existing home sales of just 4.1mn, 23% below 2019 levels but in line with the pace of the last two years.”
CR: Here is some data from the FHFA’s National Mortgage Database through Q1 2025 showing the distribution of interest rates on closed-end, fixed-rate 1-4 family mortgages outstanding at the end of each quarter since Q1 2013.

As of Q2, 71.3% of outstanding loans were under 5% (about 2%+ below current mortgage rates). These low existing mortgage rates make it financially difficult for homeowners to sell their homes and buy a new home since their monthly payments would increase sharply.
And here is a graph of existing home sales since January 1994.
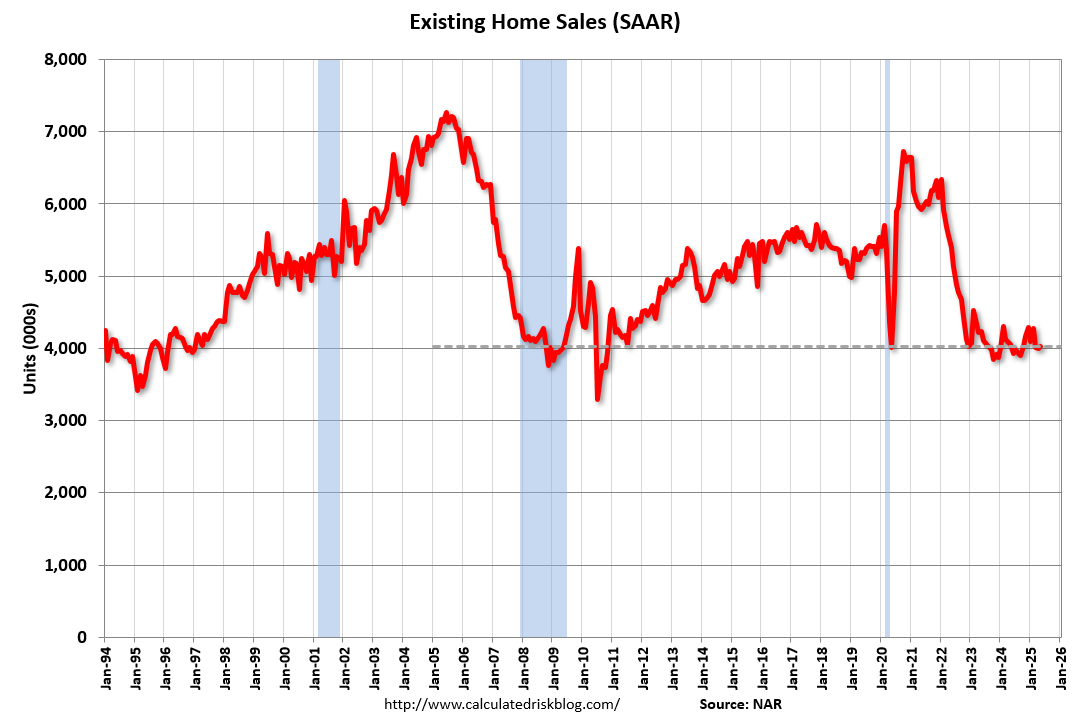
Goldman is forecasting 4.1 million existing home sales this year. In 2024, sales were 4.06 million (lowest since 3.83 million in 1995) and sales in 2023 were at 4.09 million.
Year-to-date in 2025 (through May), sales are down 2.8% NSA compared to the same period in 2024.
Goldman on single family housing starts: “Limited available housing supply has kept single-family homebuilding extremely resistant to higher interest rates so far … However, that resilience seems to be reaching its limits … We expect single-family housing starts to decline 11% this year to 0.91mn in total (vs. 1.02mn in 2024) and to end the year around a 0.83mn annualized pace.”
CR: When mortgage rates increased sharply in 2022, I noted there was some “good news” for homebuilders. The record low levels of existing home inventory (less competition), combined with the homebuilder’s ability to offer mortgage rate buydowns, kept new home sales and single family starts at decent levels. Now that existing home inventory has increased sharply - and new home inventory has increased - single family housing starts will be under pressure.
This graph shows single and multi-family housing starts since 2000 (including housing bubble).

Single-family starts (red) decreased in June and were down 10.0% year-over-year. Year-to-date in 2025 (through June), single family starts are down 6.9% NSA compared to the same period in 2024.
Goldman on house prices: “Against the backdrop of an easing housing market, we expect national home prices to rise just 0.2% December-over-December this year and 0.8% next year.”
CR: I wrote about this last week: Will House Prices Decline Nationally in 2025? I concluded: “Based on the trend, the increase in inventory (and months-of-supply), it appears house prices will be unchanged or down slightly in 2025.”
Here is a comparison of year-over-year change in the FMHPI, median house prices from the NAR, and the Case-Shiller National index.
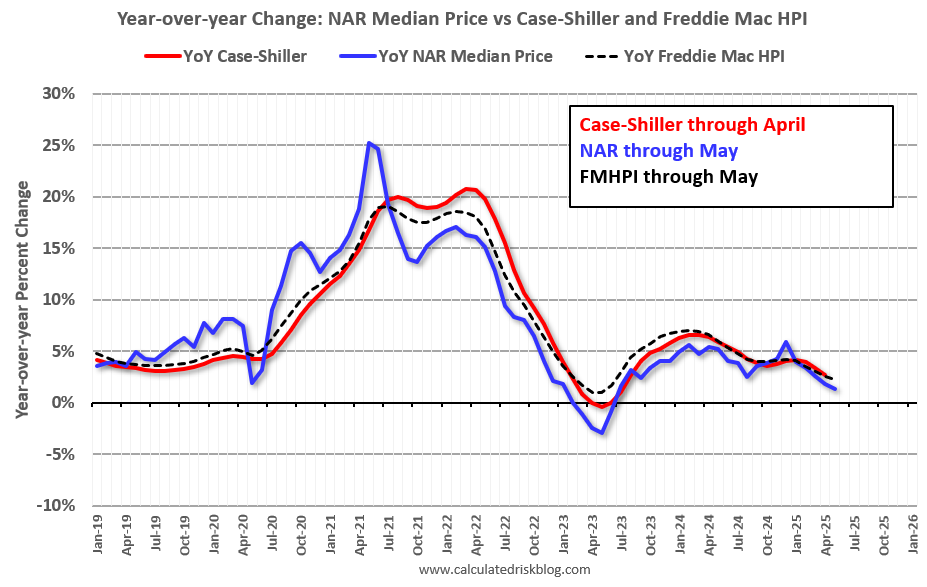
The Freddie Mac House Price Index and the NAR median prices (up 1.3% YoY in May) appear to be leading indicators for Case-Shiller. The Case-Shiller index was up 2.7% YoY in April. All of the indexes are showing less growth year-over-year.
In general, I agree with Walker’s analysis, although I may be slightly more pessimistic.