Part 2: Current State of the Housing Market; Overview for mid-June 2025
Yesterday, in Part 1: Current State of the Housing Market; Overview for mid-June 2025 I reviewed home inventory, housing starts and sales. I noted that the key story right now for existing homes is that inventory is increasing sharply, and sales are essentially flat compared to last year. That means prices will be under pressure (although there will not be a huge wave of distressed sales). And there are significant regional differences too.
In Part 2, I will look at house prices, mortgage rates, rents and more.
These “Current State” summaries show us where we came from, where we are, and hopefully give us clues as to where we are going!
House Prices
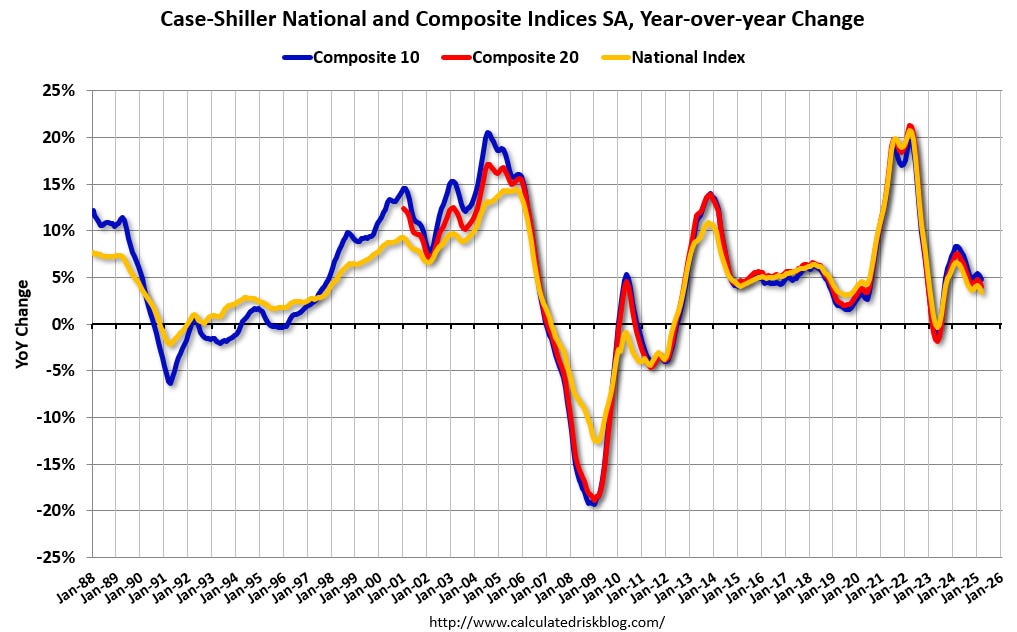
The Case-Shiller National Index increased 3.4% year-over-year (YoY) in March and will likely be lower year-over-year in the April report compared to March (based on other data).
The Composite 10 NSA was up 4.8% year-over-year. The Composite 20 NSA was up 4.1% year-over-year. The National index NSA was up 3.4% year-over-year.
The MoM decrease in the seasonally adjusted (SA) Case-Shiller National Index was at -0.30% (a -3.5% annual rate). This was the first MoM decrease since January 2023.
Three months ago, I wrote Policy and 2025 Housing Outlook I updated my outlook for 2025, and for house prices I noted …
The following content is for paid subscribers only. Thanks to all paid subscribers!
Keep reading with a 7-day free trial
Subscribe to CalculatedRisk Newsletter to keep reading this post and get 7 days of free access to the full post archives.


